
Dashboard
The Samlab Dashboard is a lightweight web server that provides an interactive user interface for annotating images, monitoring experiments, and analyzing results. It can be run simply from the command line to view local results, or setup as a centralized service for collaboration among team members.
For this tutorial, let’s begin by starting the server from the command line:
$ samlab-dashboard
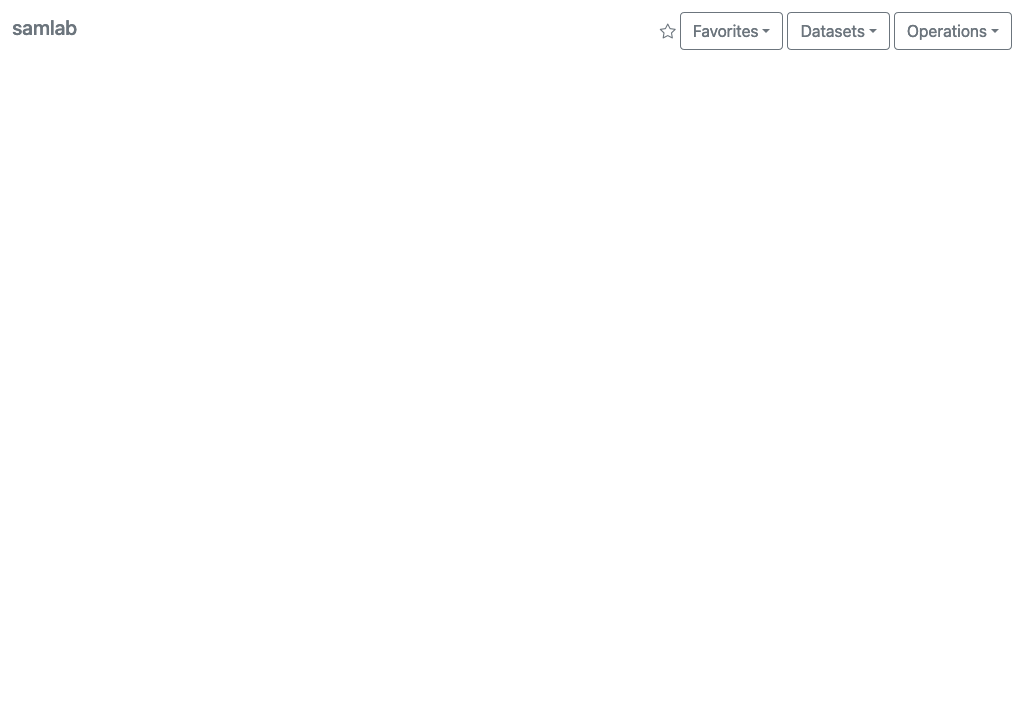
The server will start, and automatically open the dashboard interface in a web browser:
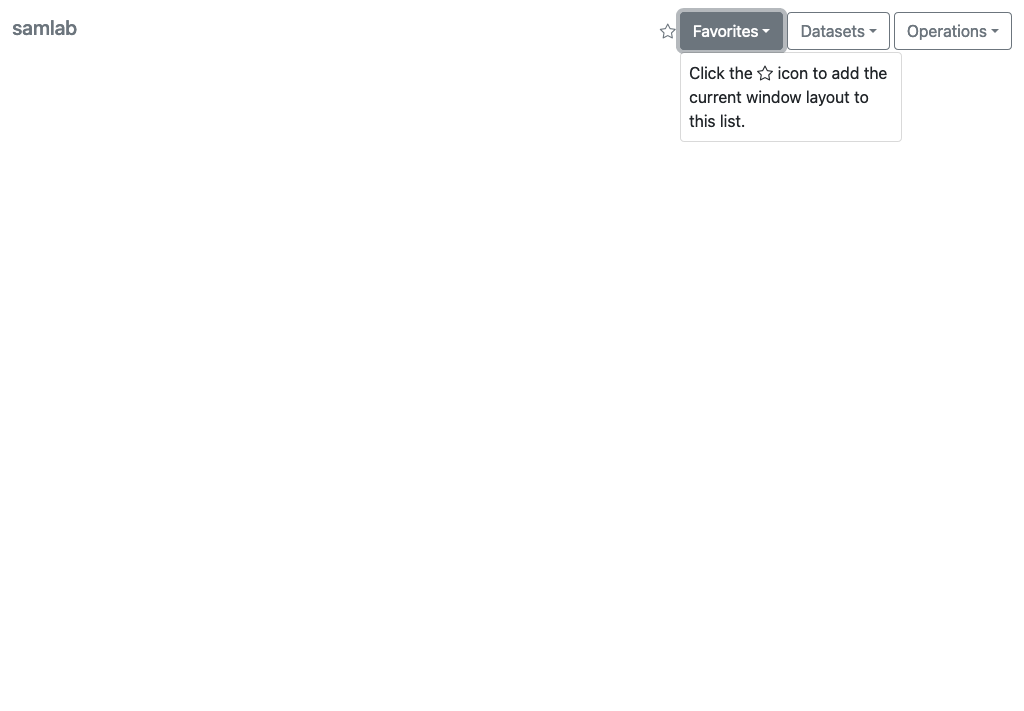
Let’s examine the menus in order. The Favorites menu lists dashboard layouts that have been favorited for later recall or sharing with collaborators. Since we haven’t favorited anything yet, the menu is empty:
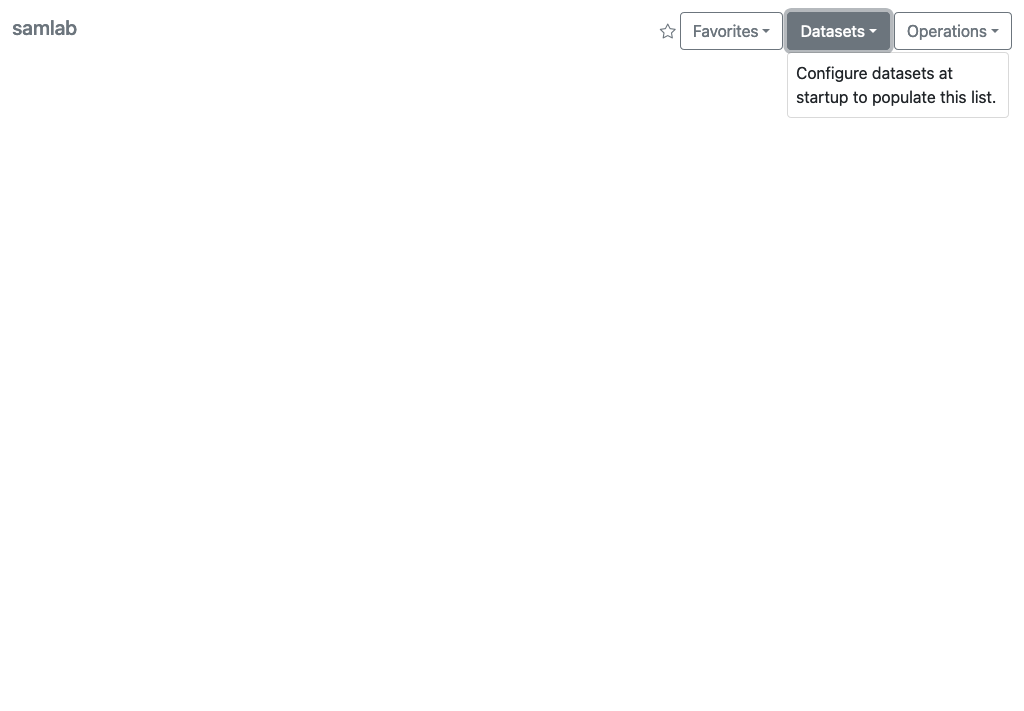
The Datasets menu lists all of the data sources that have been registered with the server. Since we haven’t registered any yet, it too is empty:
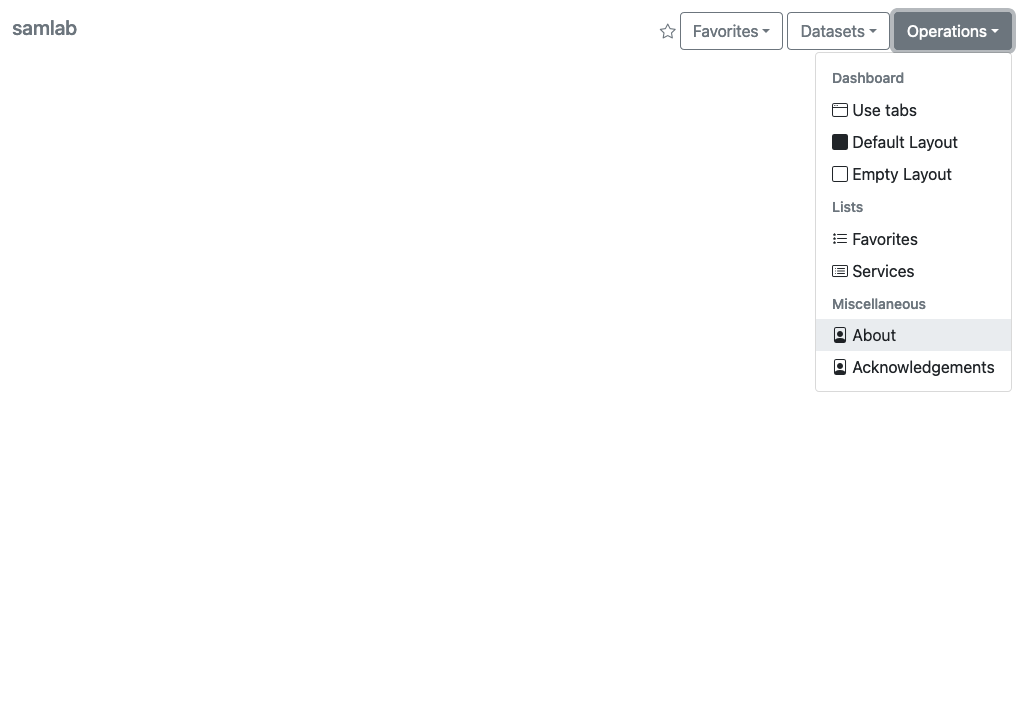
The Operations menu provides a set of generic commands for managing the dashboard layout, information lists, and displaying acknowledgements:
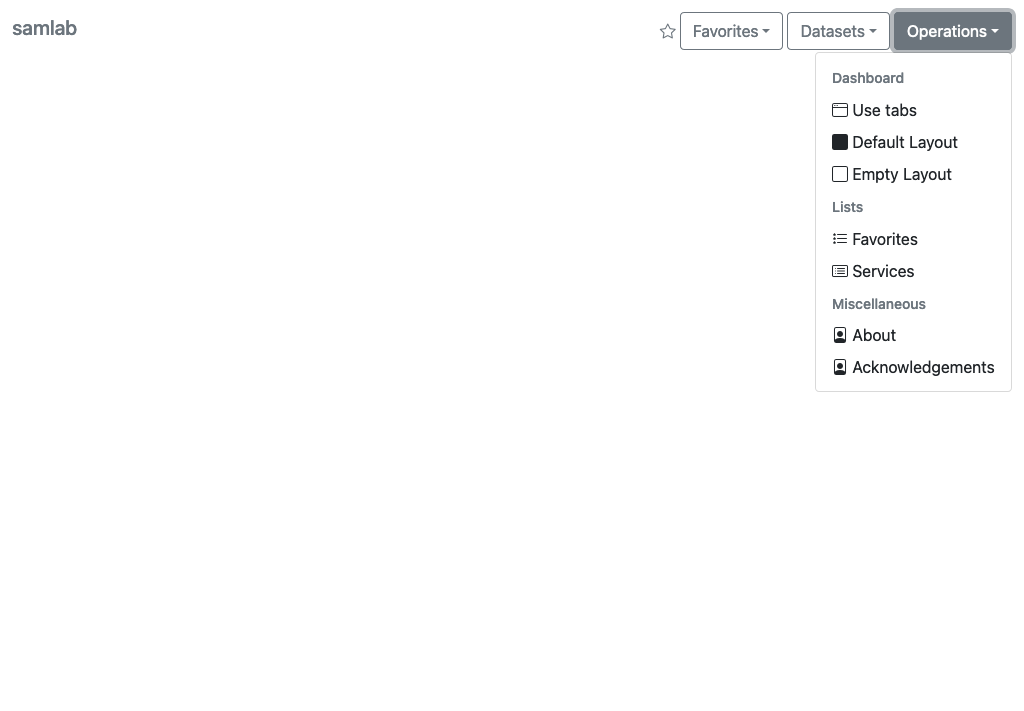
Let’s use the latter to get some familiarity with the Samlab user interface. Start by clicking on the Operations > About menu:
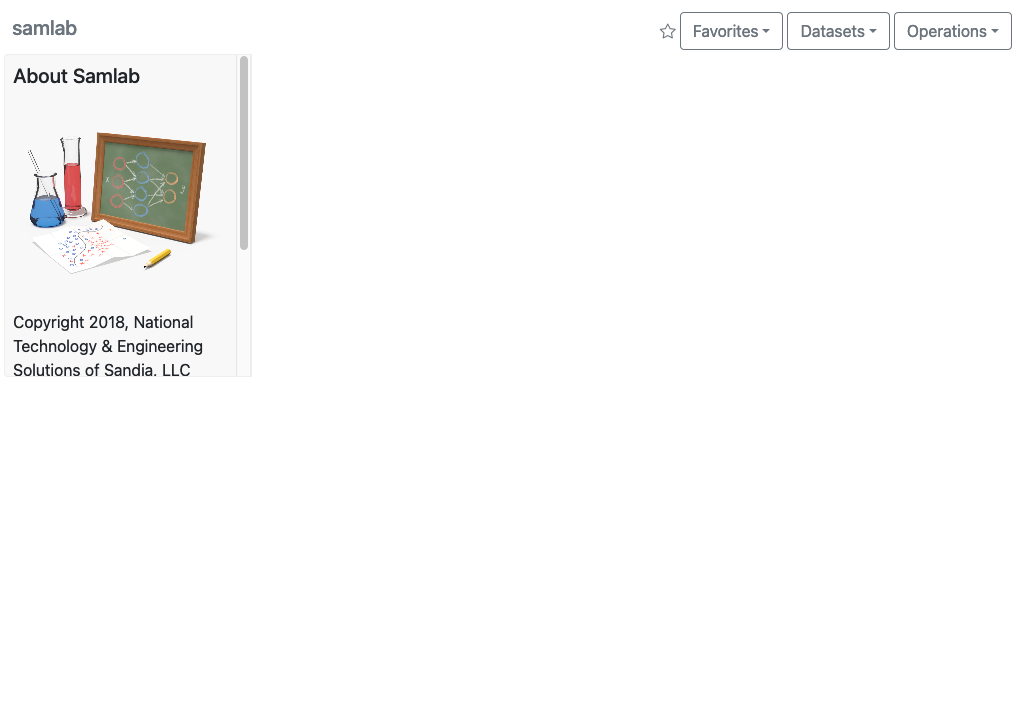
This will open an About Widget:
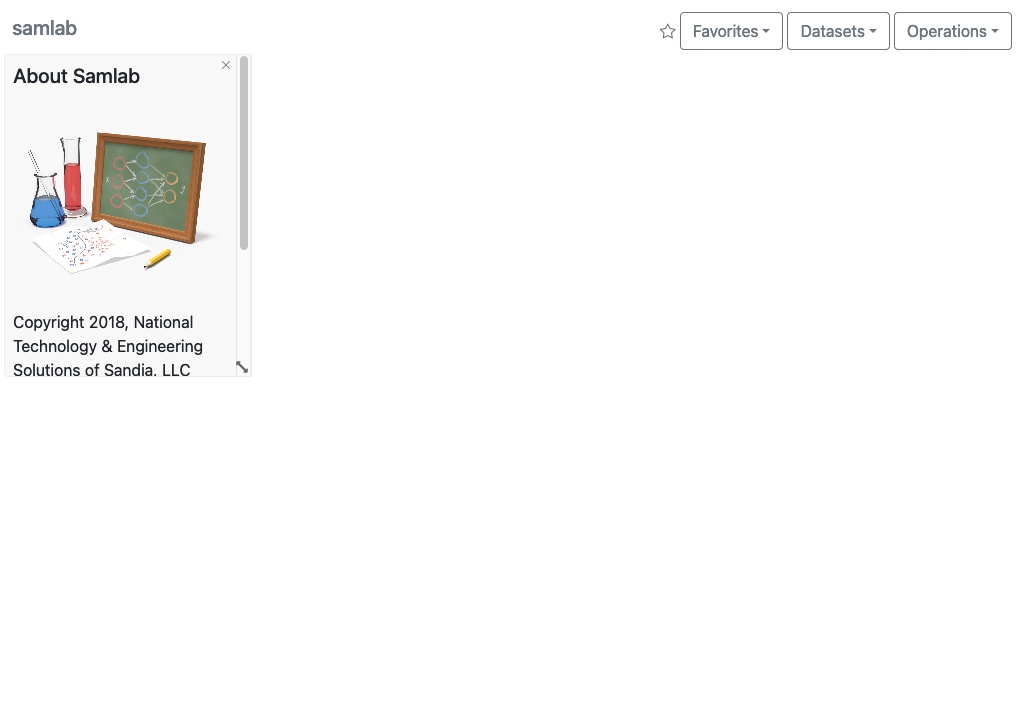
Samlab widgets are windows that can be moved and resized to arrange the dashboard however you like. If you hover the mouse over a widget, you will see that it has a close button in the upper-right corner, and a resize handle in the lower-right corner:
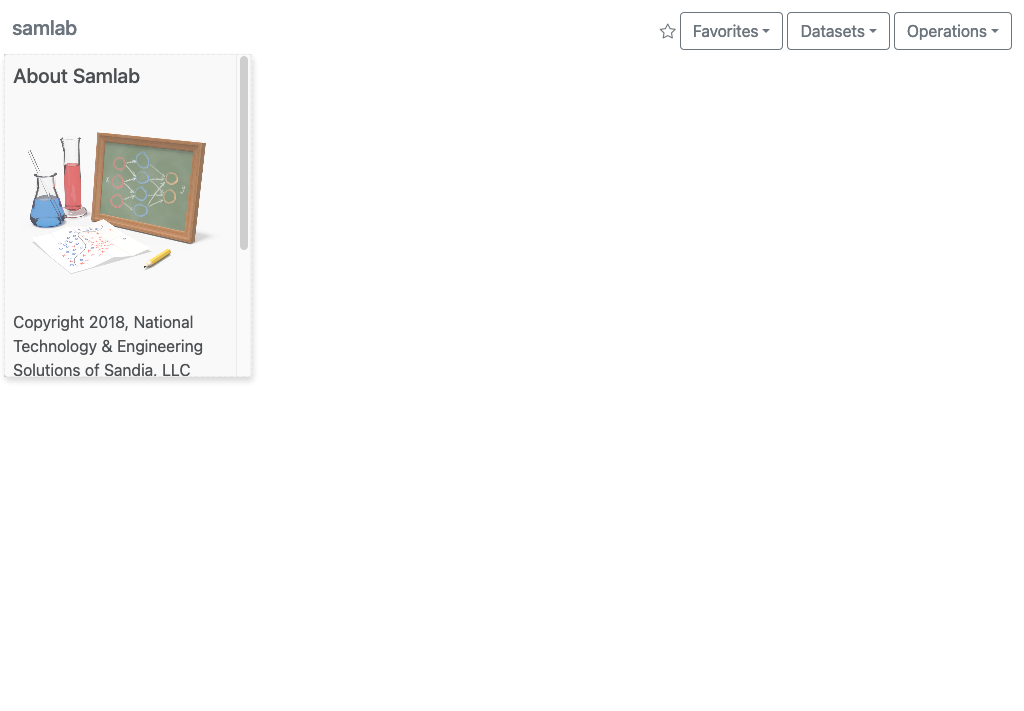
To reposition a widget, hover the mouse over the move region near the top of the widget:

Then drag the widget to a new location:
[ ]: